IoT Automatic Weather Station

Introducing VIYAT-X, our IoT powered automatic weather station designed to provide you with accurate real-time information about local weather conditions. This device is equipped with multiple sensors, allowing it to measure temperature, rainfall, humidity, pressure, wind speed and wind direction. With its sophisticated technology, it revolutionizes the way you monitor and understand the environment around you. Our IoT device is designed to be user-friendly, offering seamless integration with your smartphone or other compatible devices through our software VIYAT. We offer an integrated and intuitive interface through which you can access the data and information you need at your fingertips. For complete technical specifications, click the link below.
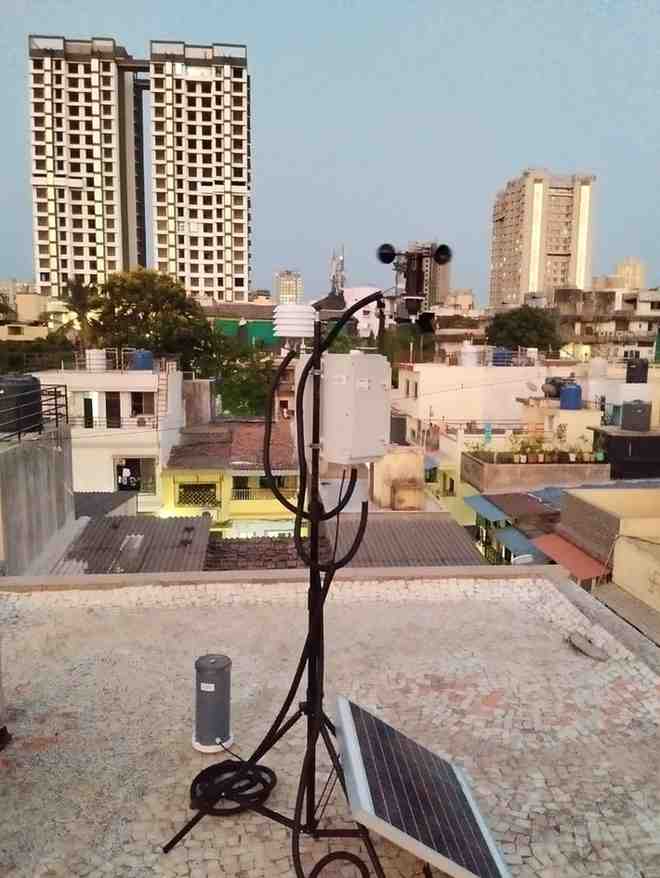
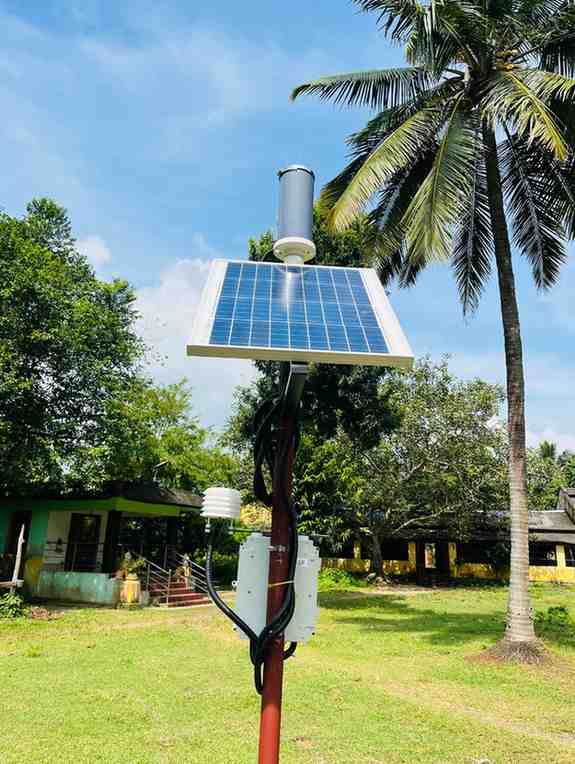
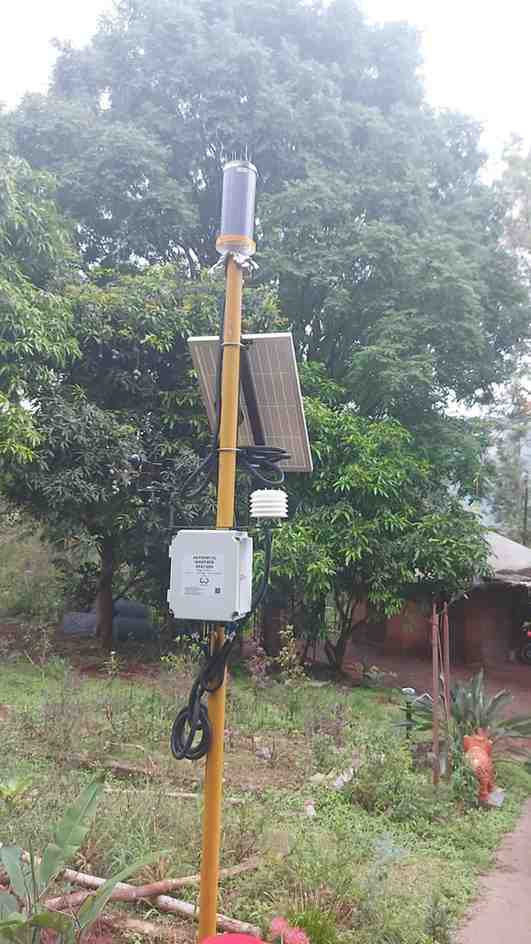
VIYAT installed at various locations.
Our product installations across India.
VIYAT installed at various locations.

VIYAT at Burhar, Madhya Pradesh

VIYAT at Bangalore, Karnataka

VIYAT at DOGR, Pune, Maharashtra

VIYAT at IIT Bombay

VIYAT at Ratlam, Madhya Pradesh

VIYAT at Kandivali, Mumbai

VIYAT at Konark, Odisha

VIYAT at Sholayur, Kerala

VIYAT at Bakhatgarh, Madhya Pradesh

VIYAT by WeatherCast Solutions

VIYAT at Windfarms, Gujarat
Software


Admin
Introducing our dashboard, VIYAT, which is a software tool to visualize data from our IoT device. The Admin dashboard offers a comprehensive overview of data along with powerful visualization that allows easy monitoring of all devices and helps make quick inferences. The historical data provides a platform to analyze trends and provide valuation insights on weather and microclimate.
Sub-Admin
The Subadmin dashboard offers a strategic overview of the users under the respective Admin. It provides access to real-time and historical data, allowing Subadmins to monitor user activity and analyze trends. This role bridges the gap between Admins and Users, providing essential insights and support to enhance overall data management and user experience.


User
Users can access their personalized dashboard to view the real-time weather data in a user-friendly format. Apart from viewing the data in balloon format, there's an option to view it in graphical format as well to analyze the trend, which may help the user make decisions. Depending on the level of subscription, we also provide predictions and advisory directly to the user on their dashboard.

